Little Changes Today is a conservation themed blog with weekly informative posts aimed at suggesting how you can personally improve the planet. Posts include weekly articles, species information and other interesting information to allow you to become more informed about the natural world.
To round off this Olympic week the creature we’ll be
learning about today is the national animal of Brazil, the jaguar.
Jaguars are the third largest feline in the world behind
tigers and lions; this also means that they are the largest cat in the
Americas. Unlike many of the other large cat species jaguars currently have
fairly sizable populations in different areas of South America and so a survey
in 2008 made the IUCN red list classify them as near threatened. This is due to
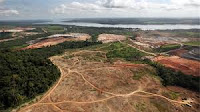
the ever increasing pressure being applied on the species through deforestation
because of illegal logging and other activities. Despite the sound of this
information though it is important for efforts to be made to protect and
conserve the jaguar, because as of 2002 54% of its historic range had been destroyed
and so there is a strong likelihood of a tipping point coming soon which will see
a drastic decrease in total populations driven by lack of habitat. This time
point is drawing ever closer as populations have been slowly decreasing since
2002.
Contrary to popular belief jaguars unlike other cats
actually enjoy water in fact a large amount of their diet is made up of fish,
turtles, capybaras and even caimans. However due to their original large range
which used to stretch from Argentina to Arizona the jaguar will take an
extremely wide variety of prey. It is common for jaguars to hunt on the ground
but not unheard of some animals taking up positions in trees which allows them
to pounce onto their unsuspecting prey from above. Once they have succeeded in
catching a prey item jaguars sometimes bury their prey so as to save it for
later.
Like the majority of big cats (excluding lions) jaguars are
solitary animals usually only coming together to breed. In Brazil, Peru,
Colombia and Mexico it is estimated that there are around 1.7-4 adults per
100km2 with males possessing territories which overlap several small
female territories.
Along with the habitat destruction which is creating heavily
fragmented populations which jaguars have to cope with there is also pressure
being applied through poaching. Up until the mid-1970s the jaguars coat was in
high demand, thankfully demand has declined to some extent. However there is
still a trade of jaguar parts for traditional medicine which has created a black
market for jaguar goods. Some jaguars are also being shot due to cattle farmers
claiming they cause a risk to their herds and so they are seen as a pest by
some.
As this is an Olympic themed post it’s sadly important to bring
to the attention to everyone what happened during the Olympic torch relay. In
the city of Manaus a jaguar escaped its handler in the ceremony that was taking
place. Despite then being shot with four tranquilizing dart the jaguar
proceeded to attack a soldier and was shot dead with a pistol. This is sadly
another example of when humans and wildlife simply don’t mix and we shouldn’t
be creating situations like this as it is believe the animal escaped and
attacked due to the stress it was being put under from being surrounded by
hundreds of people.
Hopefully although the jaguar is currently still in a stable
(ish) situation they will with the correct conservation effort remain at decent
total population number for many many more years to come.
Thanks for reading!
Check out this video of a jaguar hunting from classicgrag
So to continue the Olympic theme for this week I will be
bring you some information about the Zika virus. So this has been a subject
which has been hotly debated in the run up to the Olympics with many different
news headline and lots of Olympians refusing to compete in the event due to the
risk.
Hopefully if you read a couple of these links hopefully you’ll
be able to get a very basic understanding of what the Zika virus actually is. I
say basic but it’s important to remember however that very little is known or
understood about this virus.
The virus does have some history however as it didn’t first
appear in April 2015 (when it started appearing in the media). The virus was
actually first recognised in 1947 in the Zika forest of Uganda, it wasn’t till
1952 however that it’s first found in humans. It then was another 55 years till there was a
recognised significant outbreak of the disease in the Island of Yap (2007).
WHO website has a some interesting information on the virus
and is the place I suggest that you you start using this link.
In 2016 a article was published in The New England Journal
of Medicine which proved that it was indeed the virus which was the source of
birth defects in babies.
There has been good news on the Zika front recently however,
this article talks about the production of a test which uses saliva to
establish whether a patient is infected with the virus.
Finally this post from science alert was published a little
over 10 days ago and gives a slight insight into the stages at which vaccines
are which will bring Zika outbreaks under control (hopefully)
So it’s time for another fact file and in case you haven’t
realised the Olympics has been taking placing in Rio for the past week or so. Therefore
this week’s fact file will be focusing on Brazil and how it is currently
attempting to create the ‘greenest Olympics’ ever! Sadly however although they have made improvement in a lot of areas they have fallen short of many of the targets set by officials.
Rio pollution levels have not been portrayed well in most
media outlets across the world but if you haven’t heard the water in which a
lot of the rowers, sailors and open water swimming have been competing in is extremely polluted. This is despite
the fact that Rio officials claimed that 80% of the raw sewage being released into Guanabara Bay would be
treated in time for the games to start. However they haven’t even achieved close to this figure with only 48%
being treated.
Along with the raw sewage the bay is filled with rubbish and
dead animals. This has resulted in greater than 1 billion viruses per litre of
water within the bay. To put this into some context that’s more than 1.7
million times the level thought of as being hazardous in Europe and many other
parts of the world.
Another major issue is the destruction of certain
environments to create Olympic venues. Brazil already has a massive problem with
both legal and illegal logging but one venue which has been affecting other a
different habitat is the Olympic golf course. It has been constructed on the
edge of a delicate sandbank habitat which is home to over 238 registered
species. Beach butterflies, White-sand-lizards and rare species of
orchid and cactus are just a few of the many endangered species this construction is applying pressure too.
The carbon footprint for the spectators alone is estimated to exceed 1.380 ktonnes CO2eq, with the Game wide emissions expected to measure in at around 3600 ktonnes CO2eq.
Finally to put a brighter light on the whole situation the
5,130 medals which will be awarded throughout the course of the Olympics were
made from gold mined so called sustainable conditions with the gold medals
being completely free of mercury and the silver medals are comprised of 30%
recycled material.
This post is again focusing on the methods used to map the
variation in Earth’s climate over its history and this time we’ll be focusing
on the use of proxy measurements.
Proxy measurements take many forms and can provide
information on climate for a few hundred years up to many millions of years.
However like the measurements currently being used which were discussed in the
last post each method has its own flaws.
So the first methods which most of you will have heard of is
the use of tree rings or dendrochronology, this method has many benefits for
instance trees can be found nearly on every continent an
d so a good spread of
data can be gathered. However there are drawbacks the width of tree rings are
not solely affected by temperature factors such as rain, soil temperature and
age will also have an influence and so need to be considered. Through research
we have been able to learn that conifer tree ring width changes exponentially
with age so this can be compensated for. Other tree species ring width are not
so easy to read however such as Oaks, this is a drawback as species such as Oaks
tend to have a longer life span and so can provide more data when sampled.
A second method used to monitor climate change is through
the use of Ice cores. These provide general information on climate across the
global due to the isotope composition within the layers. There are several
different Oxygen isotopes (O16 and O18) and it is the
composition of these isotopes within the ice cores which suggest historic
temperature. This is possible due to the fact that each isotope has a slightly
different boiling temperature and so the ratios which they are found within the
ice cores give a suggestion to the previous temperature at the equator which is
where the majority of water evaporates from to create the snow at the poles. There
are again problems with ice cores however for instance they can only be found
in certain locations. Along with this they can be affected by water flowing
through the ice layers disrupting the isotope composition, these ratios can
also be affected where the ice touches the bedrock. Dating the layers can cause
issues as they require a significant event such as a volcano to lay down ash so
as to act as a time point within the ice layers otherwise samples cannot be
used as they are not accurate enough. Finally ice cores can capture gas bubble
within them and these give information about the atmospheric composition in the
past and so suggest at historic temperatures.
A further method which many of you won’t have heard of is
the use of soil sediments magnetism to provide temperature data. This has been
put to use in China with sediment known as loess. Temperature and rainfall
effect how magnetic the sediment is and so historic temperature can be extrapolated
from these levels as warmer wetter years create a higher level of magnetism.
The drawback with this method however is the fact that sites where this is
possible are extremely limited.
There are many other methods which have been used to provide
accurate measurements on historic temperatures. Further methods include pollen
and fossil records, Ocean sediments, stalactites and stalagmites CaCO3 composition
to name just a few. Each of which has their own drawbacks and benefits and so
as a collective they provide an almost complete image of earth climate variation.
So currently across the world there are many different groups of people who are attempting to find a solution to the planets need for fuel. Bio-fuels and other non-carbon based fuels such as solar and wind turbines are currently leading the field but these neglect the problem of the excess CO2 and they all have limitations such as the need for sunlight or wind.
Another method which bypasses these problems is to use CO2 are the raw materials and create fuel. We have been capable of creating fuel from CO2 for well over 20 years now (see link 1) but the ability to do so is not the problem. The issue arises with practicality of the process, previously the energetic costs of the fuels creation, to be a viable option it needs to provide as close to the amount of energy you put in as possible and the source energy needs to be abundant.
This latest article claims that they have created a new method which uses a synthetic leaf to create fuel from CO2 and sunlight and more importantly they claim that the process is cost effective unlike previous methods.
So Its time to start a new section of this blog and I hope you all enjoy it.
Each week I'll be posting a couple of interesting facts on a variety of different topics related to conservation and ecology. Hopefully it will be something just to give you a break on a Monday.
This week the facts will focus on the global waste crisis!
On average a person in the UK throws away their own body weigh in rubbish every seven weeks, whilst in the USA on average 4.4 pounds of rubbish is thrown away per person per day. When this number is converted it means Americans throw there body weight of rubbish away every 6 weeks.
The United States, Russia, Japan, Germany and The United Kingdom make up the top five most wasteful nations as of 2006. However it is estimated that by 2030 China will be producing more than double that of the USA at 533 million tons.
Sweden is currently setting an extremely good example which should be emulated by other nations. This is because although Sweden produces the same amount of waste when compared to other European countries, less than 1% of this waste makes it to landfills. This is due to the 32 waster to energy plants which have been consuming 50% of the countries waste annually. in fact these plants are now so effective that Sweden have been importing an extra 80,000 tons annually.
Finally of the 41 million metric tonnes of electronic waste binned every year (2014) the majority of it is illegally exported to African countries such as Ghana where there are vast graveyards of broken equipment. This waste is then stripped of valuable parts before being burnt which pours pollutants into the atmosphere.
To finish this post off I think you might enjoy a look around this website, it shows a couple of scary counters, check it out!
So as I’m sure a lot of you have seen there are estimates on
how the Earth’s climate has changed for many thousands of years. All of them
are suggesting that we are currently experiencing an upward trend which isn’t
great news but that is not what this post is going to be focusing on. Humans
have only really been measuring temperatures for the last few hundred years, so
the question is where did these reading come from?
Well there are so many different methods of measurin
g
climate that I’m going to do split it into a couple of different posts.
To start with we are going to look into the current methods
of measuring temperature in really time. Now in most cases this means that an
item known as a Stevenson shelter is used. It is possible that you’ve even seen
one of these, possibly out the window while waiting at an airport. A Stevenson
shelter is a standardised white box which lifts a thermometer away from the
heat being radiated from the ground whilst being well shaded and receiving a
good amount of air flow across a standard thermometer. There are problems with Stevenson shelters
however, for instance until recently very few of these boxes were found in the
southern hemisphere, this has leads to historic data being unevenly distributed
across the global. Another issue is the physical location of each shelter, as to
get reliable long term data ideally shelters should remain in the same spot. Unfortunately
increased urbanisation creating both heat island and the need for space has meant
that a lot of shelters are being moved which can also disrupt data.
It’s not only air temperature which records are kept on, sea
surface temperatures have also been monitored for several hundred years, but
the methods of doing so have been changing. At first a wooden bucket was
lowered of the side of a ship and the temperature was gained from this small sample. This wooden bucket was then replaced with a canvas bucket in the late
19th century which caused a spike in temperatures due to the
insulating properties of canvas and wood. This practise was again changed
during World War 2 as the water sample was taken from the engine inlet valve
instead of the side of the ship so again a second jump in temperature readings
was seen. The lack of consistencies within the measuring protocol has meant
they require a standardisation so as a consistent record can be created. There
are also further problems with measuring sea surface temperature which are similar
to Stevenson shelters in the fact that in the beginning ships were usually
confined closer to shore the majority of the time, so overall coverage of readings
are at points an issue. In recent years a modern method for monitoring sea
surface temperature has been developed which uses satellite imaging to provide
nearly complete coverage sea across the world. Yet again these measurements
need to be standardised to continue temperature records. These satellites can
also be used to measure sea level rises.
The final modern method of measuring deep water temperatures
are Agro floats. These are autonomous robots which are capable of descending
two thousand meters under the oceans and taking multiple different temperatures
reading over the course of ten days before it resurfaces and uploads the data
to a series of satellites. These floats are important as changes in deep sea
temperatures could seriously disrupt their productivity and so have a knock on
effect on shallower waters and terrestrial environments. However like ever kind
of measurements there are limitations, for instances there have been problems
with the floats becoming trapped under ice when taking reading close to the
poles and so the spread of data is disrupted again.
So these are just a few modern methods which are utilised to
measure
the changes in the Earth’s climate to allow us to see how human
activities and natural variations are effecting global temperatures. However as
I said earlier this is just the tip of the iceberg, we currently have accurate global
temperature records for many thousands of year so how was these achieved?
The answer is through the use of proxy measurements.
Stay tuned for the second of these two posts which will look into exactly how proxy
measurements are used in historical records.
Thanks for reading!
Check out this link which shows a remarkable amount of
progress in the UK when it comes to shopping bags.